Featured Fragment – HumunGIS Importance of GIS
By D. Brad Hatch and Emily Calhoun
Since this past Wednesday (November 13, 2019) was Geographic Information System (GIS) Day, we’ve decided to dedicate this week’s blog to highlighting how archaeologists use GIS as a tool to better understand and interpret archaeological sites. We use GIS (through the computer program ArcGIS) to link archaeological data to specific geographic locations. Once we can link our data geographically across an area, we can begin to tease out patterns in the data that might not have been noticed otherwise. To provide an example of the archaeological application of GIS we will be returning to the Trogdon-Squirrel Creek site in Randolph County, North Carolina, which was the subject of a number of previous blog posts, including posts on eyewear, frog gigs, pottery, and more. On behalf of the North Carolina Department of Transportation (NCDOT), Dovetail Cultural Resource Group conducted data recovery excavations at the site, guided by the data recovery plan authored by NCDOT (Overton 2014).
Archaeologists have demonstrated that plow zone artifact and soil chemical distributions have the potential to reveal important aspects about the use of space on sites (e.g., Fesler 2010; King and Miller 1987; King 1988; Pogue 1988b; Wilkins 2009). Artifact data for spatial analysis at the Trogdon-Squirrel Creek site were collected through the excavation of 80 2 x 2-foot (0.6 x 0.6-m) test units; soil chemical data was collected using the systematic method of taking a sample every 20 feet (6.1 m) on grid across the site. Analysts plotted artifact and soil chemical distributions using ArcGIS, revealing significant patterns for several artifact types and soil chemicals. ArcGIS plots patterns by creating contour maps of distributions. Essentially the computer program takes the raw artifact or soil data and connects locations with similar values to create lines. These lines represent values or counts, which when plotted geographically can show how values change across a site. Where there is little change in value, the lines are spaced farther apart. Where the values rise or fall rapidly, the lines are closer together. The resulting map is similar to a topographic map, which plots changes in elevation.
Dovetail used ArcGIS to plot domestic artifacts across the site. In this case, the most illustrative domestic materials included ceramics and animal bone (Figures 1 and 2). The distribution of ceramics revealed two concentrations of artifacts. The first, and most distinct, occurred off of the southeast corner of the dwelling. This concentration of ceramics is indicative of increased refuse disposal and activity in this portion of the site, which likely stemmed from the traffic between the dwelling and the outbuilding located to the southeast. The second concentration, which is less intense and smaller in size, occurred near the southwest corner of the dwelling. This small peak, which was also noted in the distribution of architectural artifacts, likely represents a disposal area near a window or at the edge of the backyard where refuse was conveniently deposited. Overall, the ceramic distribution matches other historic artifact distributions, indicating that the northern yard was kept relatively free of refuse and that the southern yard functioned as a disposal and work space.
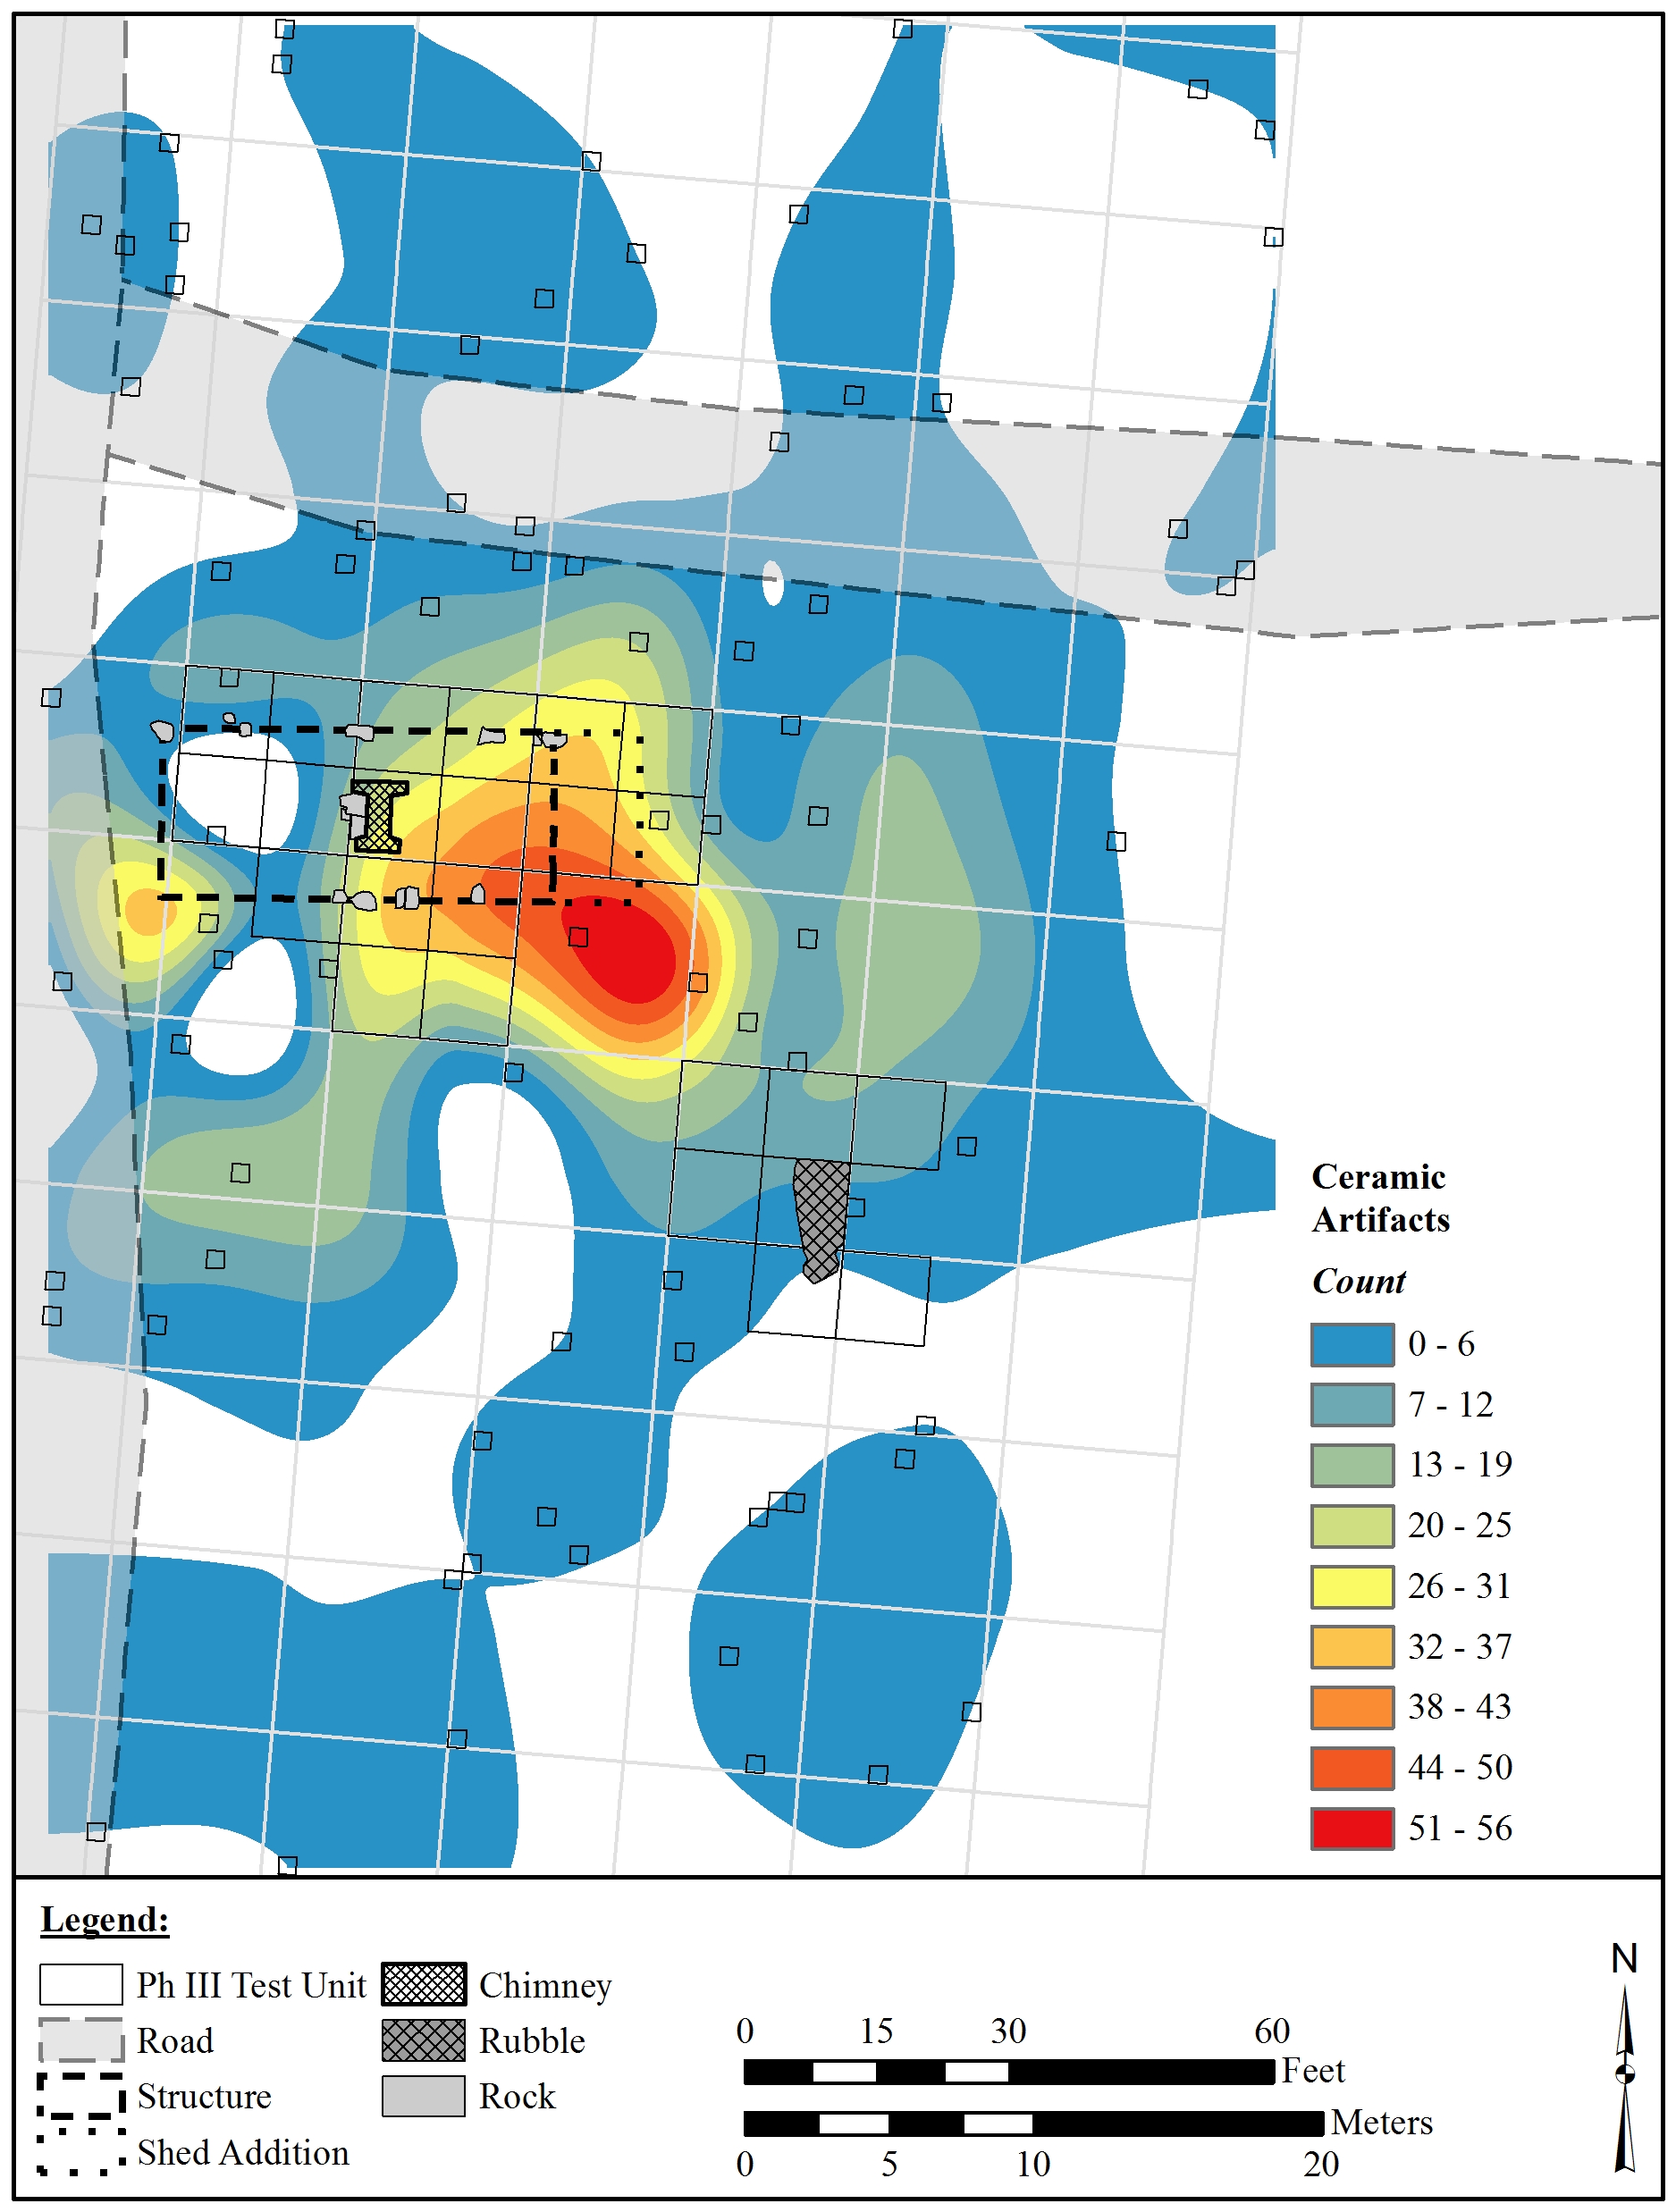
Figure 1: Distribution Map of All Ceramics.
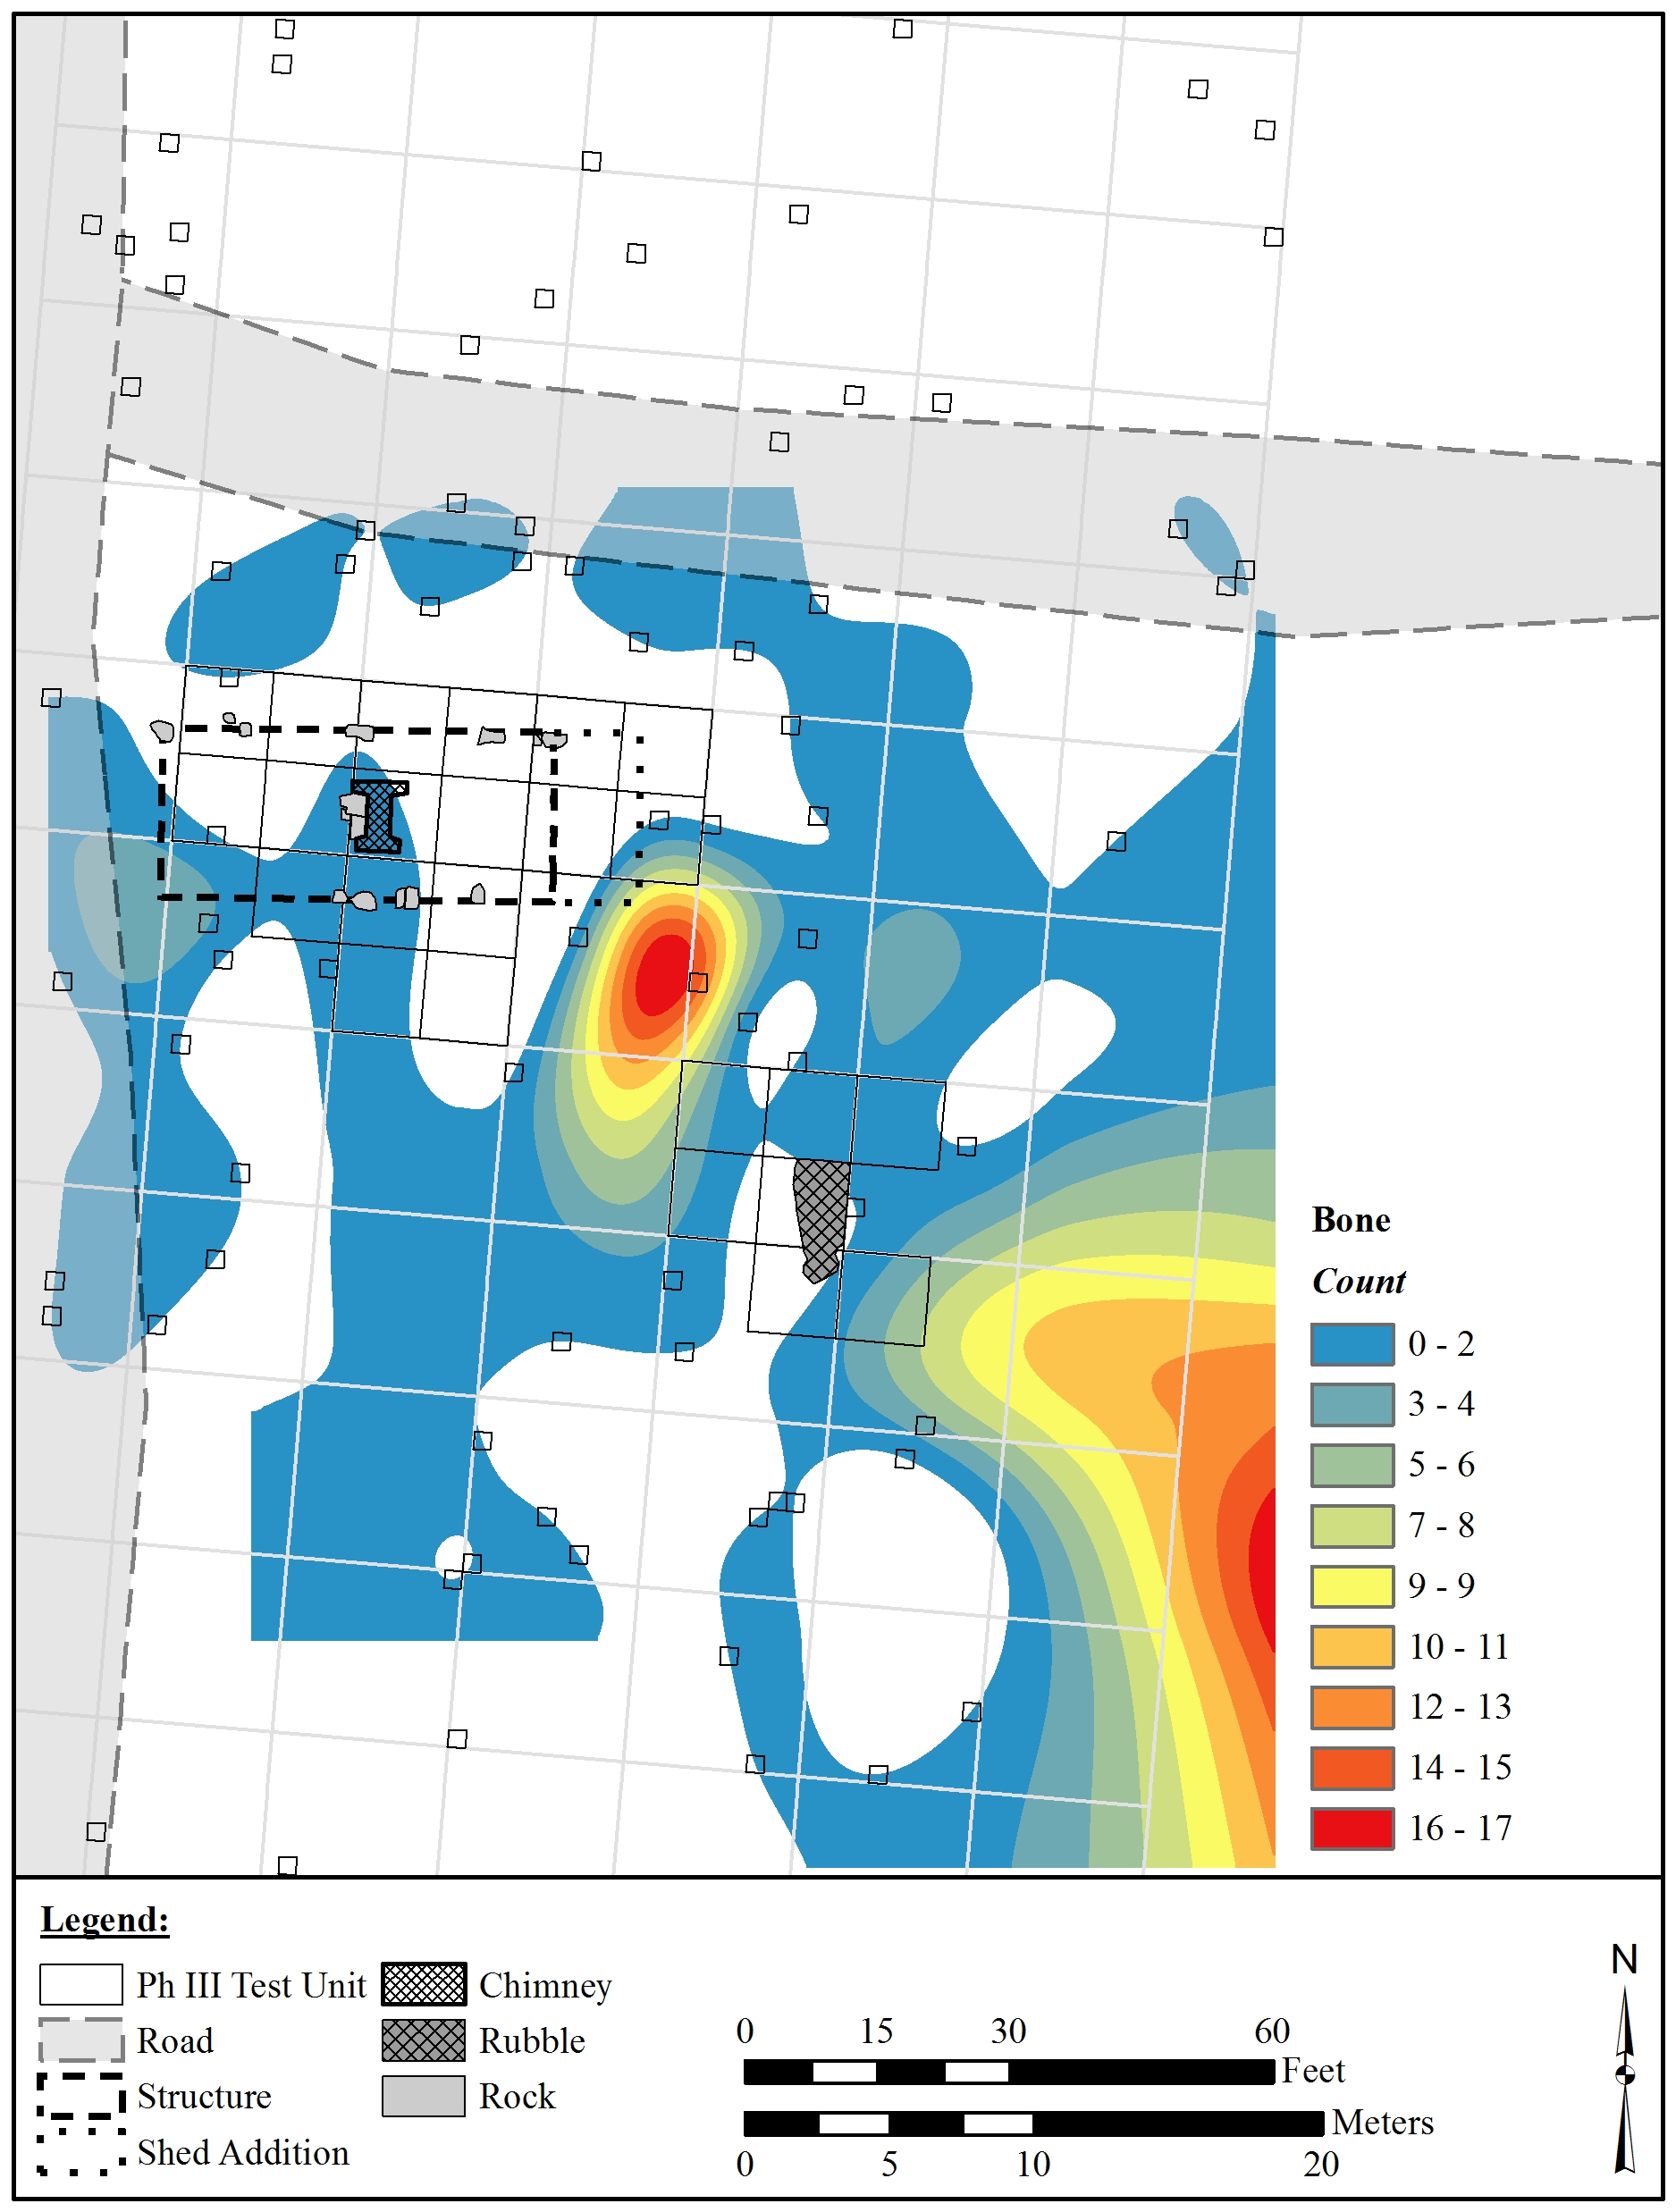
Figure 2: Distribution Map of Bone.
Soil chemicals often provide archaeologists with important additional evidence about activity at sites when more traditional artifact types are not present. Different chemicals are associated with different activities. For example, phosphorus is generally interpreted as representing organic refuse, calcium tends to represent bone and shell, and potassium and magnesium are interpreted as representing ash or burning (McCoy 2016:25–26; Pogue 1988a:3; Wilkins 2009:20). At this site the distribution of phosphorus tended to concentrate near the dwelling and an outbuilding (Figure 3). Specifically, the primary area of high phosphorus concentration occurred in a heavily used area between the two buildings. This general pattern coincides with the historic artifact distributions on site, and is almost certainly related to the disposal of domestic refuse. Dovetail archaeologists concluded, based on the high phosphorous signature, that the outbuilding was likely a detached kitchen. Refuse discarded from the outbuilding was also noted down the hill, to the east, as well as between the outbuilding and the dwelling. There are also two small peaks of high phosphorus concentration located to the north of the dwelling. These peaks are associated with the locations of two tree stumps.
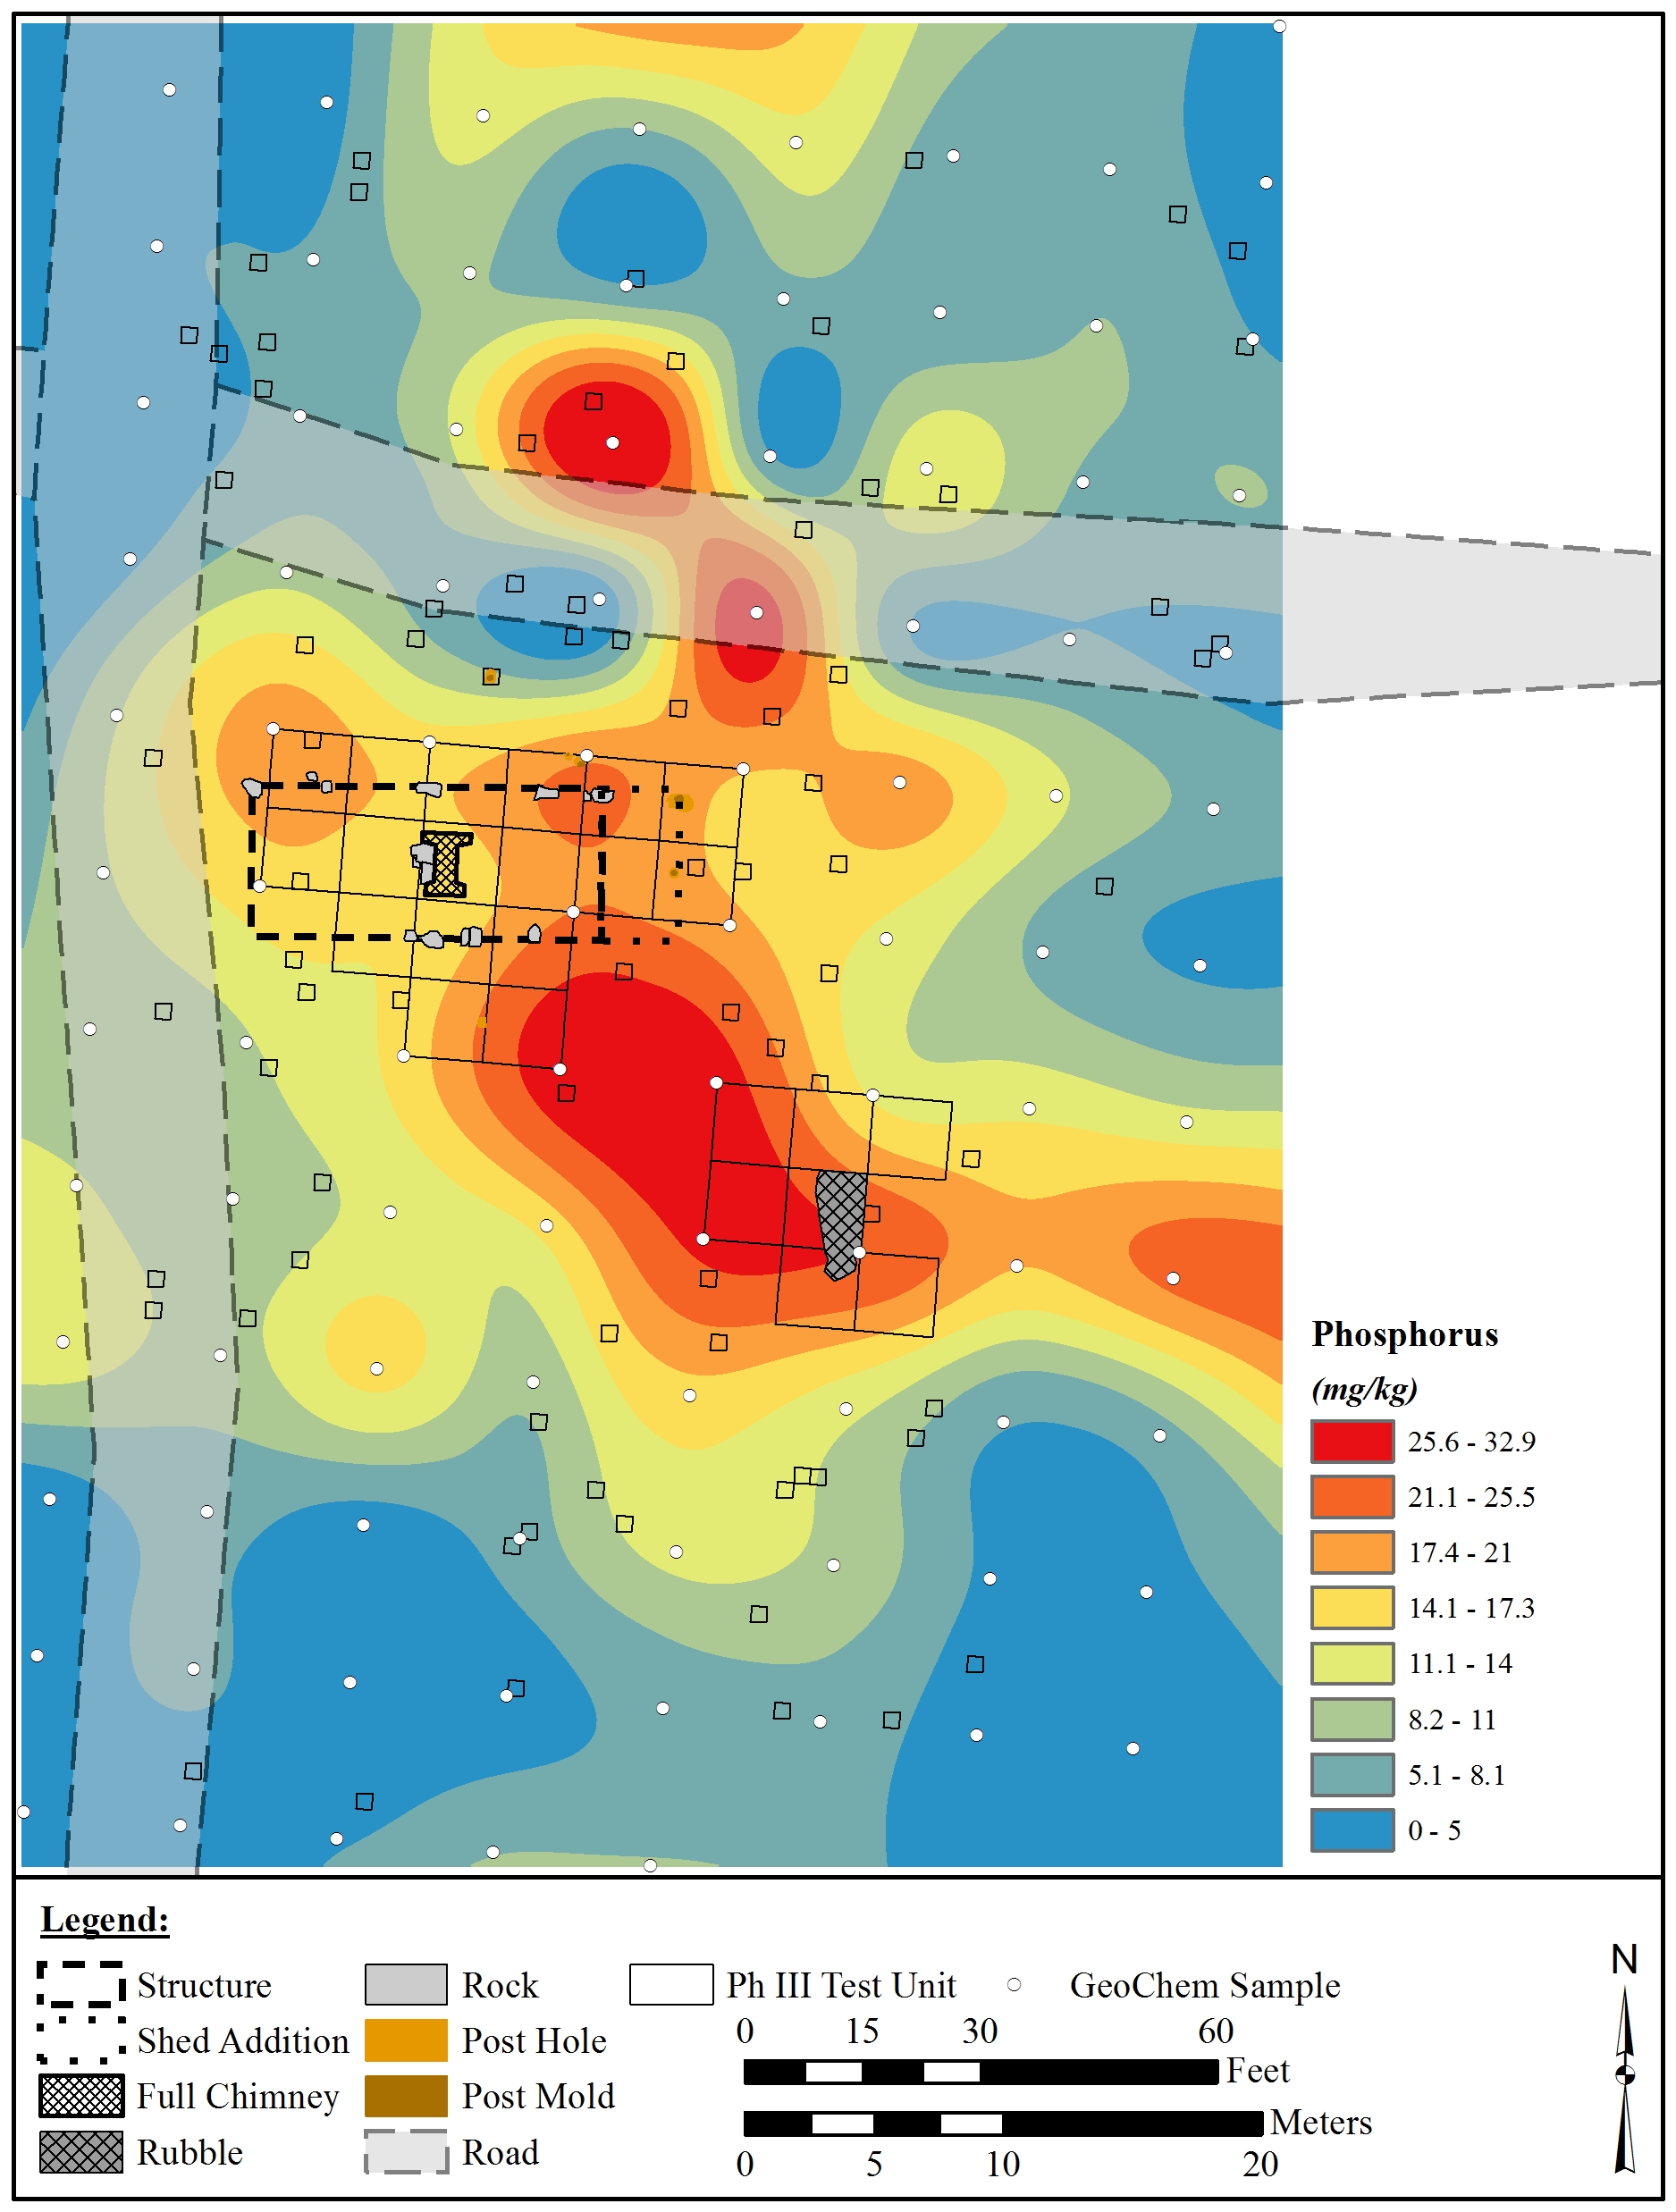
Figure 3: Distribution Map of Phosphorus.
As you can see, the application of GIS-based mapping of artifact and soil chemical distributions at the Trogdon-Squirrel Creek site was vital to our interpretation of the site. In this case the computation tools within the ArcGIS program helped to reveal activity areas. These GIS-generated maps even helped to define the location of an outbuilding, likely a kitchen. Without this analytical tool archaeologists may have overlooked the kitchen, because no foundation or obvious architectural feature marked its location. Archaeologists have many analytical tools in their toolbelts, but GIS is definitely one of the most powerful for analyzing past landscapes!
Any distributions of blog content, including text or images, should reference this blog in full citation. Data contained herein is the property of Dovetail Cultural Resource Group and its affiliates.
References:
Fesler, Garrett
2010 Excavation the Spaces and Interpreting the Places of Enslaved Africans and Their Descendants. In Cabin, Quarter, Plantation: Architecture and Landscapes of North American Slavery, edited by Clifton Ellis and Rebecca Ginsburg, pp. 27–49. Yale University Press, New Haven, Connecticut.
King, Julia A.
1988 A Comparative Midden Analysis of a Household and inn in St. Mary’s City, Maryland. Historical Archaeology 22(2):17−39.
King, Julia A., and Henry M. Miller
1987 The View from the Midden: An Analysis of Midden Distribution and Composition at the van Sweringen Site, St. Mary’s City, Maryland. Historical Archaeology 21(2):37−59.
McCoy, Curtis A.
2016 Colluvial Deposition of Anthropogenic Soils at the Ripley Site, Ripley, NY. Master’s Thesis, Department of Anthropology/Archaeology, Mercyhurst University, Erie, Pennsylvania.
Overton, Brian
2014 Archaeological Data Recovery Plan: Site 31Rd1426, Randolph County, North Carolina. North Carolina Department of Transportation Human Environment Section, Raleigh, North Carolina.
Pogue, Dennis J.
1988a Anthrosols and the Analysis of Archaeological Sites in a Plowed Context: The King’s Reach Site. Northeast Historical Archaeology 17:1–15.
1988b Spatial Analysis of the King’s Reach Plantation Homelot, Ca. 1690−1715. Historical Archaeology 22(2):40–56.
Wilkins, Andrew P.
2009 Identifying 18th Century Hidden Landscapes at Stratford Hall Plantation Using Portable X-Ray Fluorescence Phosphorus Readings on Plowzone Samples. Master’s Thesis, Department of Anthropology/Historical Archaeology, University of Massachusetts, Boston, Massachusetts.